

Weather-Based Forecasting Tool to Manage Gray Mold and Anthracnose
go.ncsu.edu/readext?381772
en Español / em Português
El inglés es el idioma de control de esta página. En la medida en que haya algún conflicto entre la traducción al inglés y la traducción, el inglés prevalece.
Al hacer clic en el enlace de traducción se activa un servicio de traducción gratuito para convertir la página al español. Al igual que con cualquier traducción por Internet, la conversión no es sensible al contexto y puede que no traduzca el texto en su significado original. NC State Extension no garantiza la exactitud del texto traducido. Por favor, tenga en cuenta que algunas aplicaciones y/o servicios pueden no funcionar como se espera cuando se traducen.
Português
Inglês é o idioma de controle desta página. Na medida que haja algum conflito entre o texto original em Inglês e a tradução, o Inglês prevalece.
Ao clicar no link de tradução, um serviço gratuito de tradução será ativado para converter a página para o Português. Como em qualquer tradução pela internet, a conversão não é sensivel ao contexto e pode não ocorrer a tradução para o significado orginal. O serviço de Extensão da Carolina do Norte (NC State Extension) não garante a exatidão do texto traduzido. Por favor, observe que algumas funções ou serviços podem não funcionar como esperado após a tradução.
English
English is the controlling language of this page. To the extent there is any conflict between the English text and the translation, English controls.
Clicking on the translation link activates a free translation service to convert the page to Spanish. As with any Internet translation, the conversion is not context-sensitive and may not translate the text to its original meaning. NC State Extension does not guarantee the accuracy of the translated text. Please note that some applications and/or services may not function as expected when translated.
Collapse ▲Strawberry Fruit Infection Risk Tool
PLEASE NOTE: THE MODEL IS CURRENTLY NOT WORKING DUE TO TECHNICAL ISSUES IN PROCESSING THE DATA: WE HOPE TO RESTORE IT. DUE TO THE AMOUNT OF NEW PRGRAMMING NEEDED, IT IS NOT CLEAR IT WILL BE FUNCTIONAL FOR 2024. WE APOLOGIZE FOR ANY INCONVENIENCE THIS MAY CREATE. SEE UPDATED RECOMMENDADTIONS IN OUR STRAWBERRY IPM GUIDE LINKED BELOW.
Botrytis fruit rot (BFR), or gray mold, (factsheet here) and anthracnose ripe fruit rot (AFR) (factsheet here) are the two most important diseases NC growers need to manage in strawberry during the harvest season. Synthetic fungicides are commonly used in non-organic systems. Every year our program along with other programs in the southeastern region evaluate products for efficacy and then publish recommended strategies in the SE Strawberry Integrated Pest Management Guide.
Currently most growers spray on a 7-day schedule. The Strawberry Fruit Infection Model, a weather-based forecasting tool, will help growers time fungicide sprays based on the weather to decrease fungicide dependence (fewer applications), reduce the risk of generating resistant pathogen populations and improve control (less disease).
Caution: The model has been validated in research-based trials in FL, SC, NC, OH and IA but not validated for all sites in NC. Also, the weather stations may not represent the local conditions on your farm.
Step-by-step guide:
1. Open the NC map for the tool. The map takes a minute to upload.
2. On the map is 33 color-coded markers (diamonds, triangles, or octagons). Each marker represents a location and the disease infection risk. At the bottom of the map is the 72 hour time period included in the disease risk model.
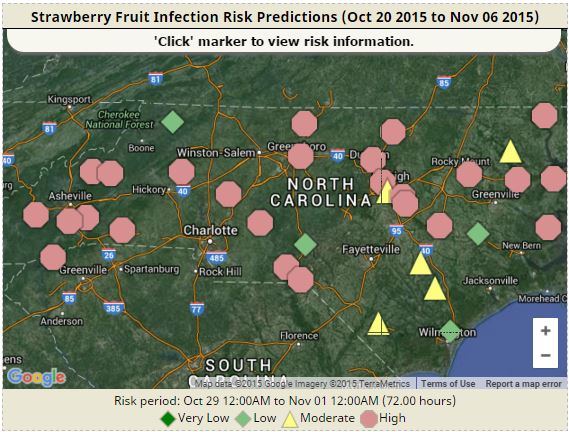
Marker Codes:
![]() Dark green diamond = Very low risk of BGM or AFR during the last 24 hours or near future
Dark green diamond = Very low risk of BGM or AFR during the last 24 hours or near future
![]() Light green diamond = Low risk of BGM or AFR during the last 24 hours or near future
Light green diamond = Low risk of BGM or AFR during the last 24 hours or near future
![]() Yellow triangle = Moderate risk of BGM or AFR during the last 24 hours or near future
Yellow triangle = Moderate risk of BGM or AFR during the last 24 hours or near future
![]() Pink octagon = High risk of BGM or AFR during the last 24 hours or near future.
Pink octagon = High risk of BGM or AFR during the last 24 hours or near future.
3. Choose the marker nearest or most representative of your farm. The table below lists all 33 sites with latitude and longitude.
NOTE: We only have 33 sites for now because these sites have been equipped with a leaf wetness sensor; this is costly and hard to maintain. In the future we hope to model leaf wetness and run models from many more sites. Currently, leaf wetness values for the next 5-7 day forecast are estimated and are based on a model. In the future we also may be able to use your weather sensory equipment to run the models for your farm!
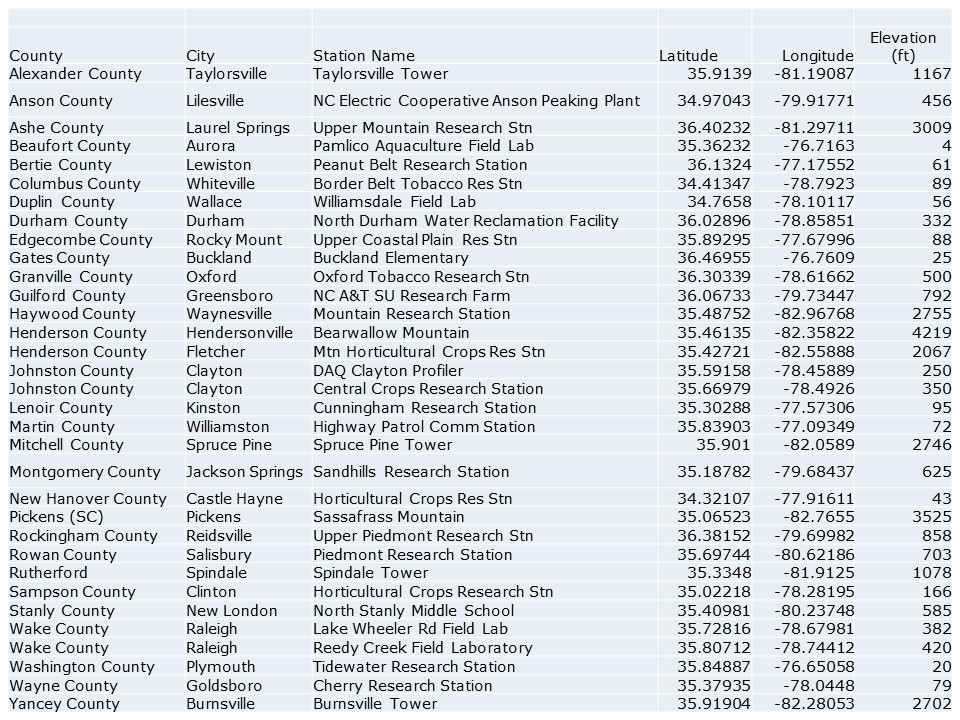
Weather Station Sites in North Carolina for Strawberry Fruit Infection Risk Tool
4) Click on a marker. A window will open with more information for that site.
a) At the top of the page choose the disease, Anthracnose (Colletotrichum acutatum) or Grey Mold-Rot (Boytritis cinerea), with the FLSAS model. We currently recommend the FLSAS (Florida Strawberry Advisory System Model) because we have more field data that supports the model’s idea.
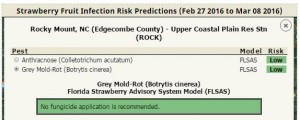
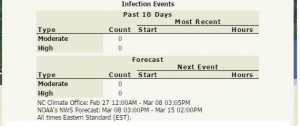
b. The Infection Events table in the middle of the page displays the number of infection events (moderate or high risk events) in the past 10 days and the date and duration of the most recent infection event. Below is the forecast for the next 5-7 days. If future weather conditions promote infection then the table will list the next date a moderate or high-risk event is expected.
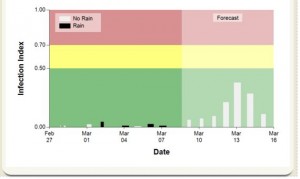
c. The graph at the bottom of the page displays risk level information and includes rain (wetness) events. The horizontal areas in color represent level of risk (green – low; yellow – moderate; or pink – high risk). A vertical black bar shows leaf wetness from a rain event, whereas the white bar (no rain) indicates leaf wetness due to other weather factors such as dew formation.
The graph and table change automatically when you chose another pest and model.
You can return to the map to select another site by clicking on the ![]() located in the upper right hand corner by the name of the station location (don’t use the back arrow on your browser). You may want to compare the risk level of other sites close to your location.
located in the upper right hand corner by the name of the station location (don’t use the back arrow on your browser). You may want to compare the risk level of other sites close to your location.
5) Use the risk level graphs to help you make your decision about treatment. See the SE Strawberry Integrated Pest Management Guide..
6) Check risk tool daily or 2-3x per week.
7) Make notes to determine if the tool was helpful. If you have questions or would like to provide feedback contact Frank Louws at frank_louws@ncsu.edu